RQ3: Final relationship evidence
The authoritative unit is (study_id, mapping_id, rq2_source_id, rq1_target_id). Each unique accepted combination has weight one. Repeated passages for the same combination are collapsed while retaining every evidence link. A paper can support several substantively different combinations.
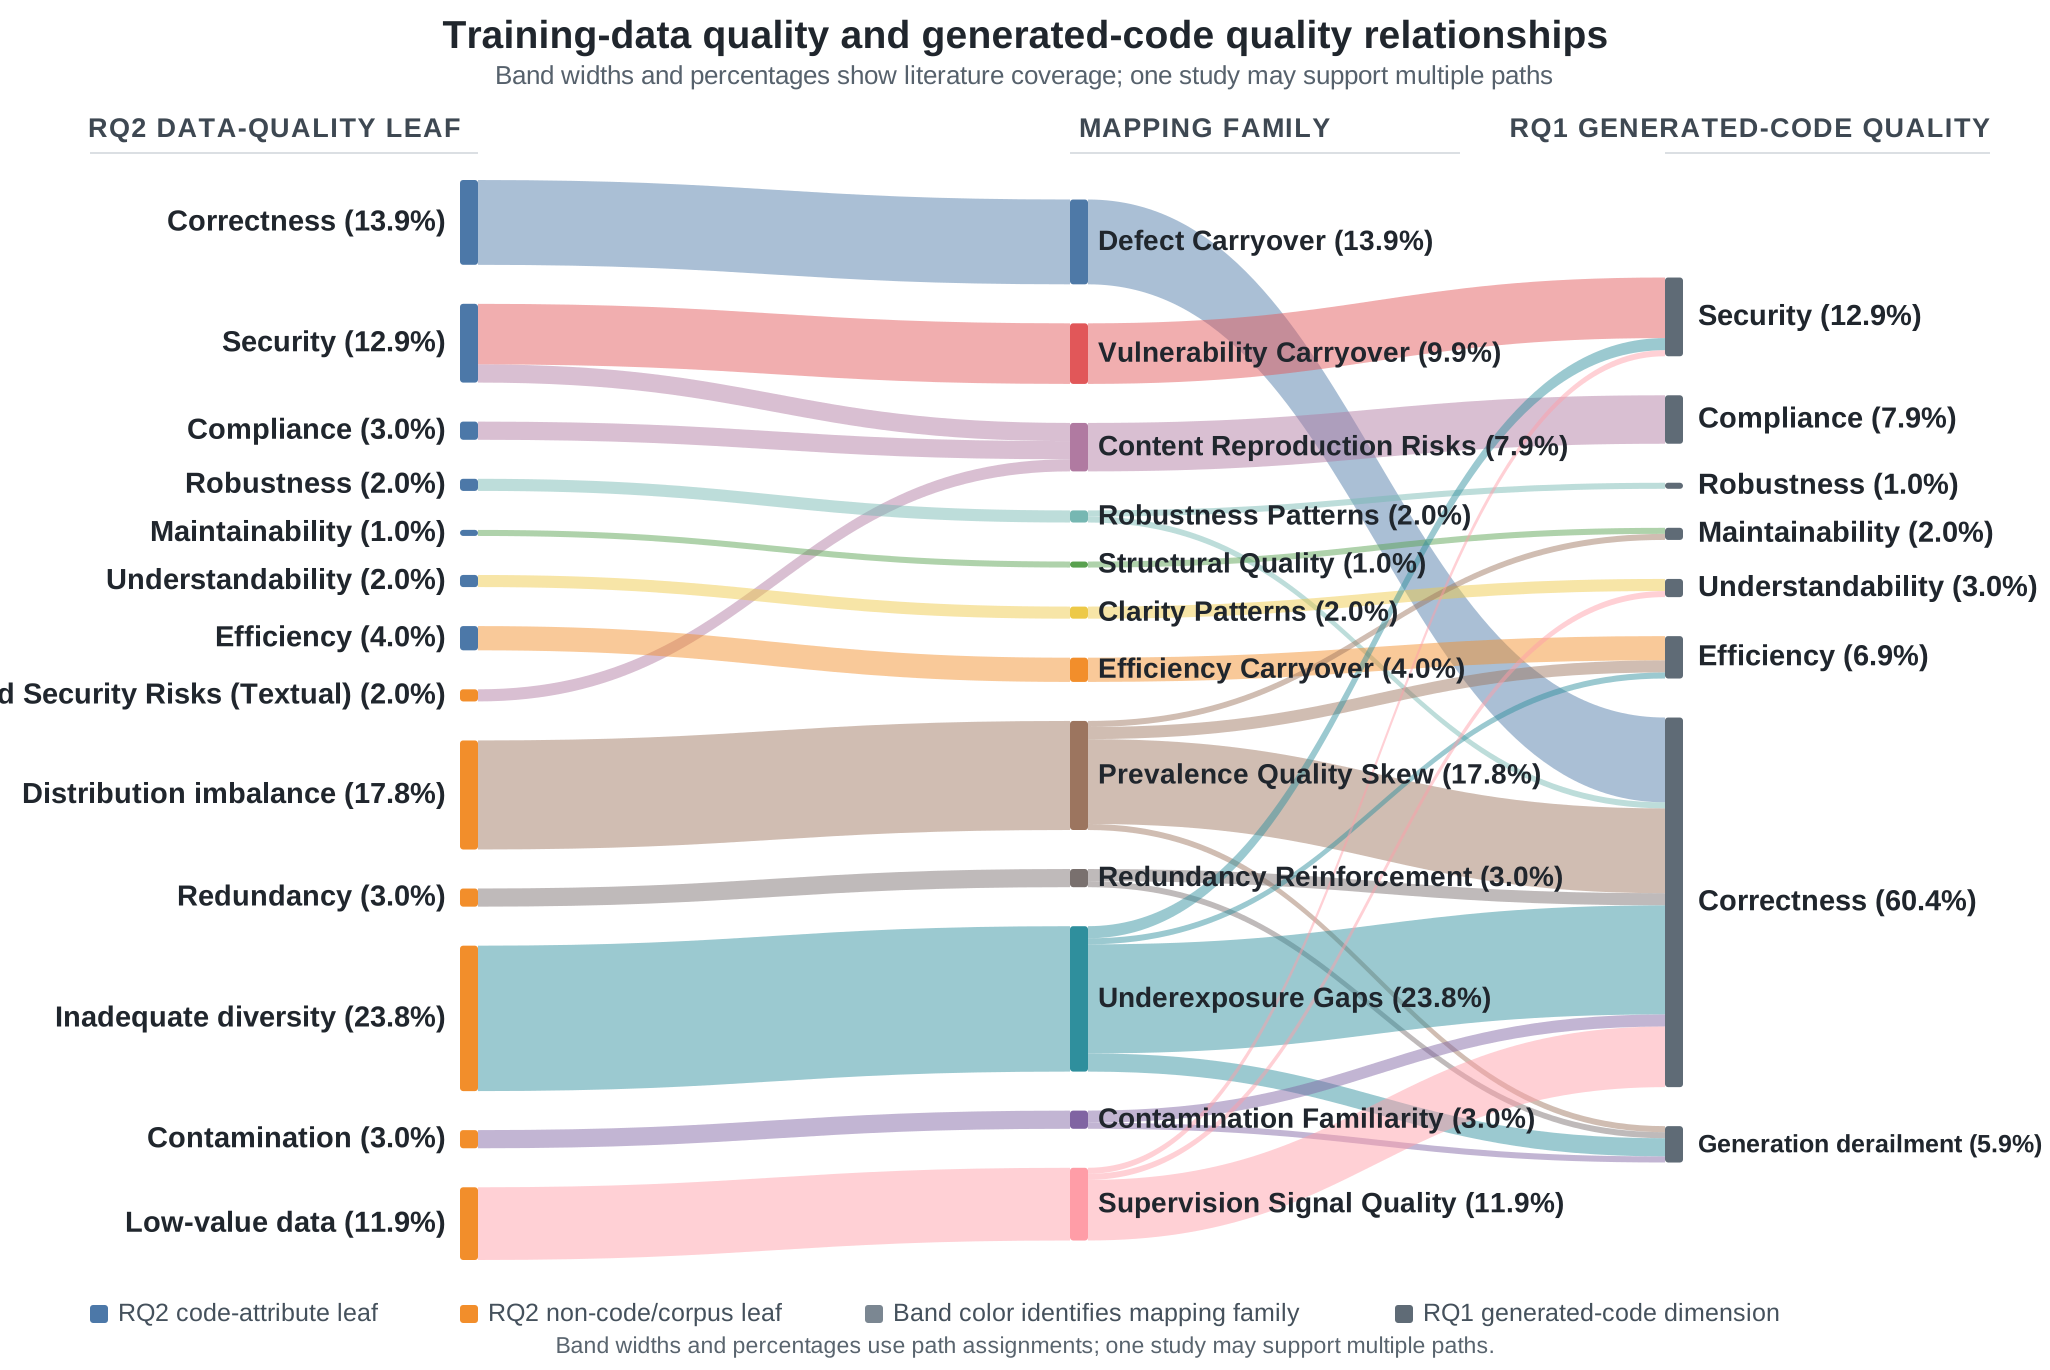
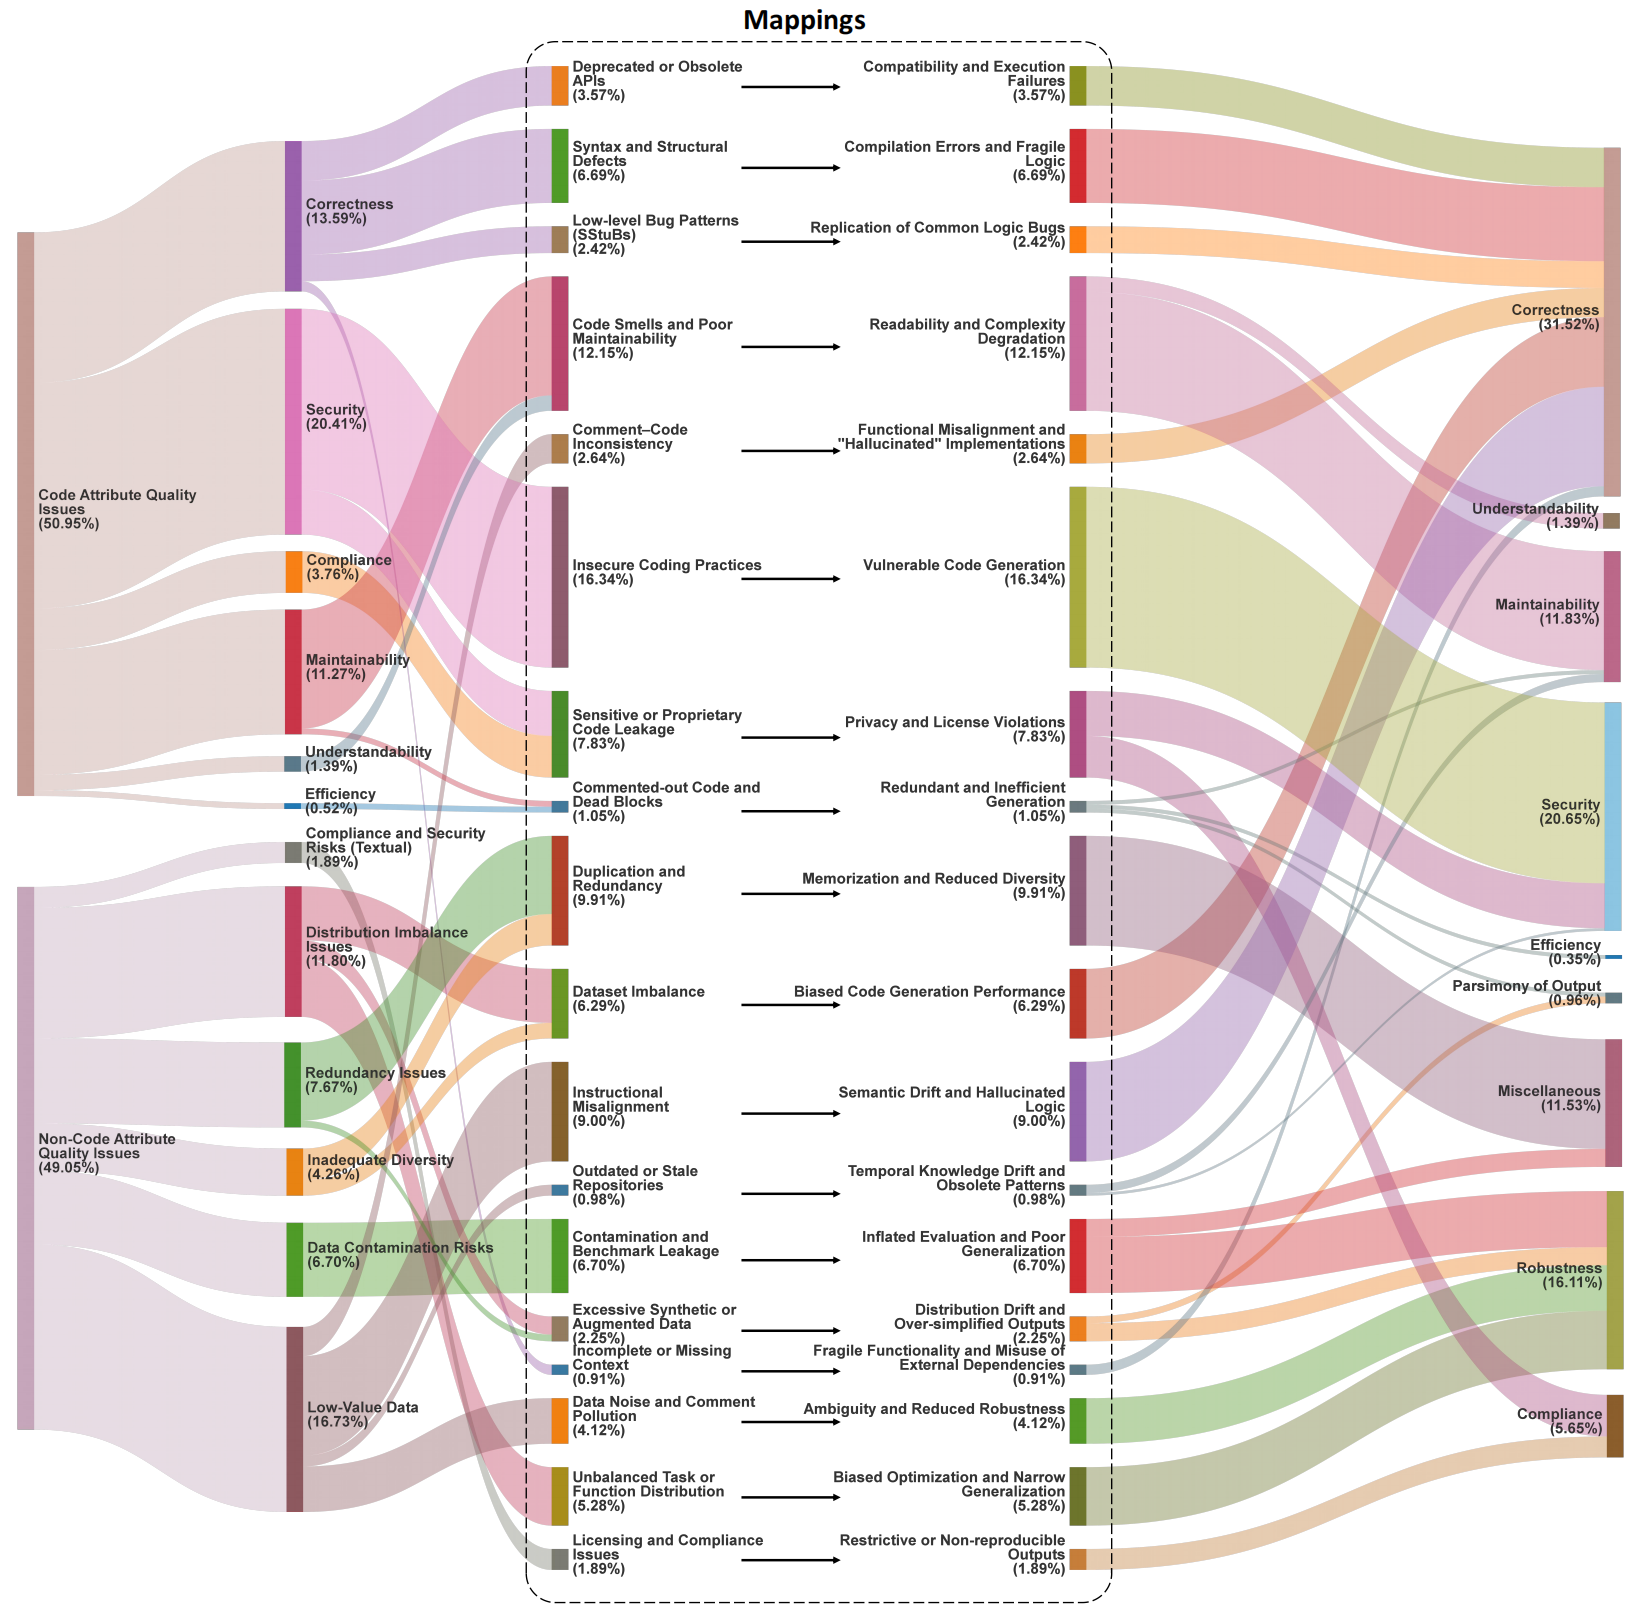
There are 101 assignments from 67 papers, 12 families, 13 RQ2 source headings, eight RQ1 outcomes, 25 atomic branches, and 37 combined graph edges. All percentages use 101 as their denominator. Counts represent literature coverage, not causal strength or effect size.
Tables and identifiers
| Table | Rows | Role |
|---|---|---|
| study_screening.csv | 114 | Final graph participation and assignment count for every included paper |
| taxonomy_codebook.csv | 25 | RQ1/RQ2 nodes, structural parents, definitions, and boundaries |
| mapping_definitions.csv | 12 | Final family definitions and routing rules |
| study_mapping_assignments.csv | 101 | Authoritative final paths, supported subtypes, evidence IDs, and qualifiers |
| relationship_evidence.csv | 105 | Only evidence used by final paths; reported conditions, outcomes, locators, and source URLs |
| path_evidence_links.csv | 107 | Normalized path–evidence bridge with direction, source location, and qualification |
| mapping_summary.csv | 12 | Family totals, percentages, and supporting paper/evidence IDs |
| sankey_atomic_branches.csv | 25 | Exact RQ2–family–RQ1 branches and supporting path IDs |
| sankey_nodes.csv, sankey_edges.csv | 33 / 37 | Combined graph with positive integer weights |
| mapping_arrow_labels.csv | 12 | Two-part display labels and complete observed endpoints |
| sankey_left_nodes.csv, sankey_left_edges.csv | 27 / 27 | Left panel: RQ2 parent → leaf → family source half |
| sankey_right_nodes.csv, sankey_right_edges.csv | 20 / 23 | Right panel: family outcome half → RQ1 dimension |
| mapping_panel_alignment.csv | 12 | Shared family order, geometry, and connector anchors |
study_id joins the paper register. mapping_id uses stable F01–F12 codes; F12 appears next to the code-attribute families in display order. evidence_id joins final evidence; source_evidence_id and M-prefixed subtype IDs preserve source-audit identities. They are identifiers, not counts or an additional taxonomy of final families. Non-consecutive evidence numbers reflect filtering to used records.
study_screening.csv describes final graph participation. A paper without a final RQ3 assignment remains an included review paper; its status does not imply exclusion from other research questions. Initial screening and consolidation checkpoints are not included.
Read reported_or_discussed, evidence_qualifiers, and notes with each path. For example, the two Robustness-Pattern paths include a bundled cleaning intervention and a study-author hypothesis about an unobserved corpus; they are not two isolated causal effects.
Figures and reproduction
The interactive combined graph and SVG are generated from the combined node/edge tables. The manuscript PDF and PNG preserve the revision’s cropped two-panel figure. Both views use the same frozen assignments.
python3 scripts/validate_release.py
python3 scripts/render_sankey.py --no-static-export
python3 scripts/render_sankey_panels.py --no-static-export
The panel renderer writes to .local/rq3-panels/. Both panels share each family’s order, count, percentage, vertical center, and height. Horizontal arrows pair family labels and add no quantitative layer. Every flow layer sums to 101. CSV shares use two decimals; figure labels use one, so rounded layer totals may differ from 100%.